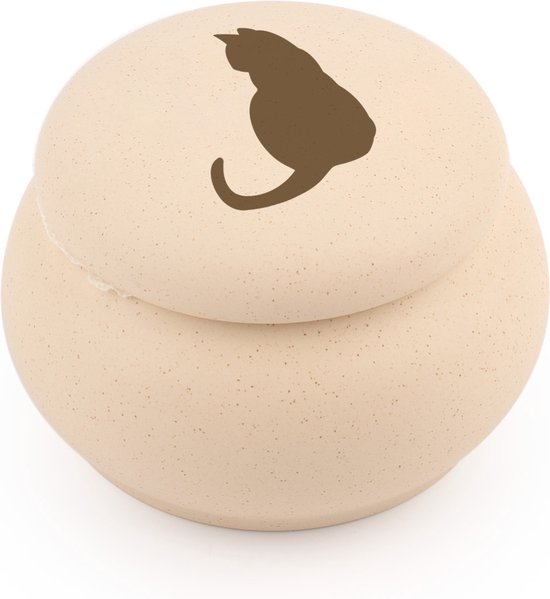
Urntjes sells urns and memorial products on Bol. With focused campaigns at the bottom of the funnel, revenue grew by 34% — while dependence on paid advertising went down at the same time.
Revenue growth compared to the same period last year.
Blended ROAS across all Sponsored Products campaigns combined.
TACoS, improved from 7.0% — an efficiency gain of 21%.
The 34% revenue growth did not come from more ad budget. It came from two things underneath it: visitors converting more often, and customers spending more per order. Sponsored Products did exactly what it should do at the bottom of the funnel — capture purchase intent — without costs rising along with it.
That last point matters most. A falling TACoS alongside rising revenue means growth increasingly does not have to come from paid traffic. Of the revenue in this period, 31% was directly attributable to advertising; the other 69% came in organically.

The Netherlands grew fastest in revenue. Belgium combined solid revenue growth with the strongest rise in orders and conversion — a sign the approach lands in both markets.
+36% revenue and 4% more orders. The strongest revenue growth of the two markets.
+33% revenue, 9% more orders and 7% conversion growth — the strongest increases across the board.
+34% revenue and 8% more units sold across both countries.
Twelve campaigns across four product groups. The white ceramic urn leads the way: the higher the advertising efficiency per group, the larger its share of total growth.
| Product group | Campaigns | Impressions | Clicks | CTR | ROAS |
|---|---|---|---|---|---|
| White ceramic urn | 4 | 66,707 | 1,731 | 2.6% | 6.36x |
| Mini urn | 3 | 31,574 | 1,011 | 3.2% | 3.57x |
| Pet urns | 3 | 31,115 | 524 | 1.7% | 3.62x |
| General / other | 2 | 47,963 | 1,208 | 2.5% | 5.29x |
| Total | 12 | 177,359 | 4,474 | 2.5% | 5.52x |
This case is deliberately not finished. We started at the bottom, where return shows up fastest, and build upward from there.
Building brand awareness, so buyers already know Urntjes before they start searching.
Branded Shelves. The logical next step to continue growth among buyers who are still comparing.
Sponsored Products. The bottom of the funnel, where buyers are ready to decide. This is the current focus.
1 October 2025 through 17 July 2026, each compared with the same period a year earlier. The source is Bol Seller Insights combined with the Sponsored Products reports.
TACoS is total advertising spend divided by total revenue excluding VAT — not just the revenue coming from ads. ROAS is ad revenue divided by ad spend. The advertising figures are lifetime figures since the campaigns started.
31% of revenue in this period is directly attributable to advertising. The other 69% came in organically. With a falling TACoS, that share keeps shifting further towards organic.
Excluding. Revenue from Bol Seller Insights includes VAT and was converted back to an amount excluding VAT for this calculation.
In the free potential scan we look at where your conversion, order value and advertising efficiency leave room — and what that is concretely worth.